8 Operation Manual for the HemaScopeCloud
8.1 User Login
8.1.1 Enter the URL in a web browser:
https://hemascope.hiplot.cn/?home=hemascope and click to access the login page.

Figure 8.1: Login Page
8.2 Homepage
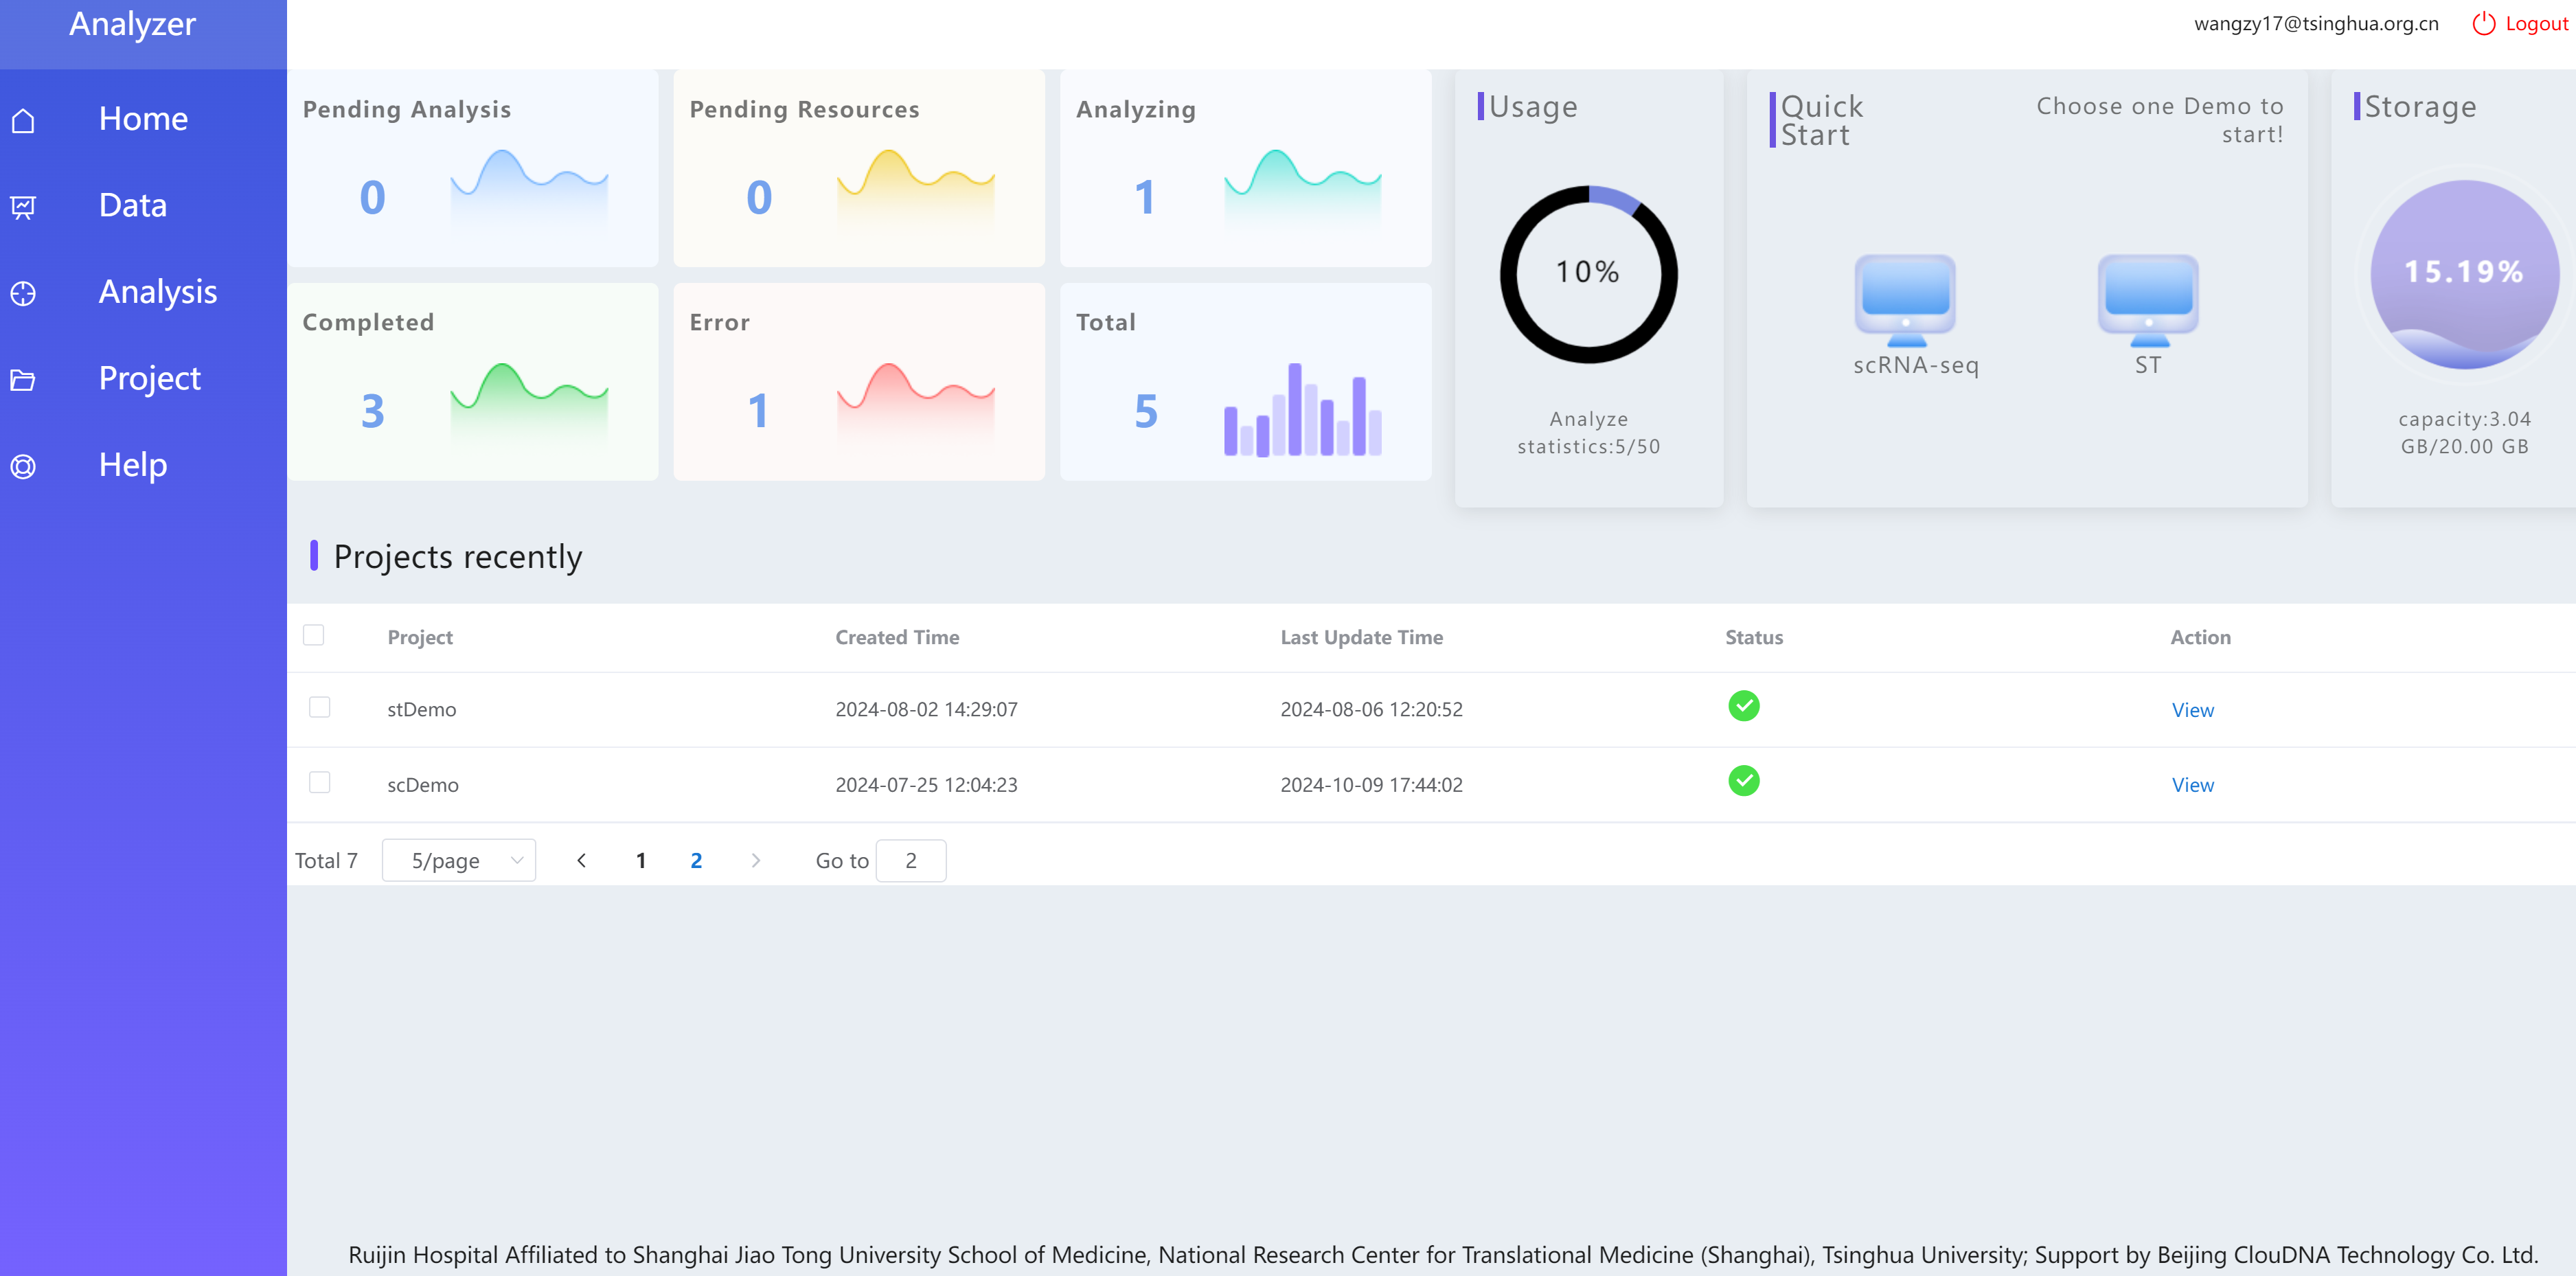
Figure 8.2: Homepage
The left side features a menu bar containing Home, Data, Analysis, Project, and Help. And the upper right section includes statistics on analysis project status, usage of analysis projects, a quick entry for creating new analysis projects, and statistics on allocated storage capacity usage.
Statistics on Analysis Project Status
Pending Analysis:Waiting for analysis, not yet submitted for analysis.
Pending Resources:Waiting for resources, analysis submitted and awaiting resource allocation.
Analyzing:Currently analyzing.
Completed:Analysis completed.
Error:An error occurred during analysis.
Total:Total of all analysis statuses.
Usage Statistics for Analysis Projects: Number of used analysis projects / Total number of allocated analysis projects. The current allocation for the system is 50 projects. For additional free computational resources, please contact the developer.
Quick Entry for Creating New Analysis Projects: Supports quick access to the new analysis project pages corresponding to two pipelines.
Storage Capacity Usage: Used Storage Resources / Allocated Storage Resources.
The lower section displays the most recently run analysis projects. By default, it shows demo projects upon initial entry. Clicking the “View” option on an entry in the Projects section allows you to access and analyze that specific analysis project.
8.3 Data Page
The Data page includes storage for Demo sample project data as well as Personal project data. Data under the Demo tab can be downloaded, while the Personal tab allows users to create new folders and upload files.
8.4 Analysis Page
It lists two analysis pipelines: sc_HemaScopeCloud and st_HemaScopeCloud, serving as entries for creating new analysis projects. Click the Analysis button to access the new project and execution page for that pipeline.
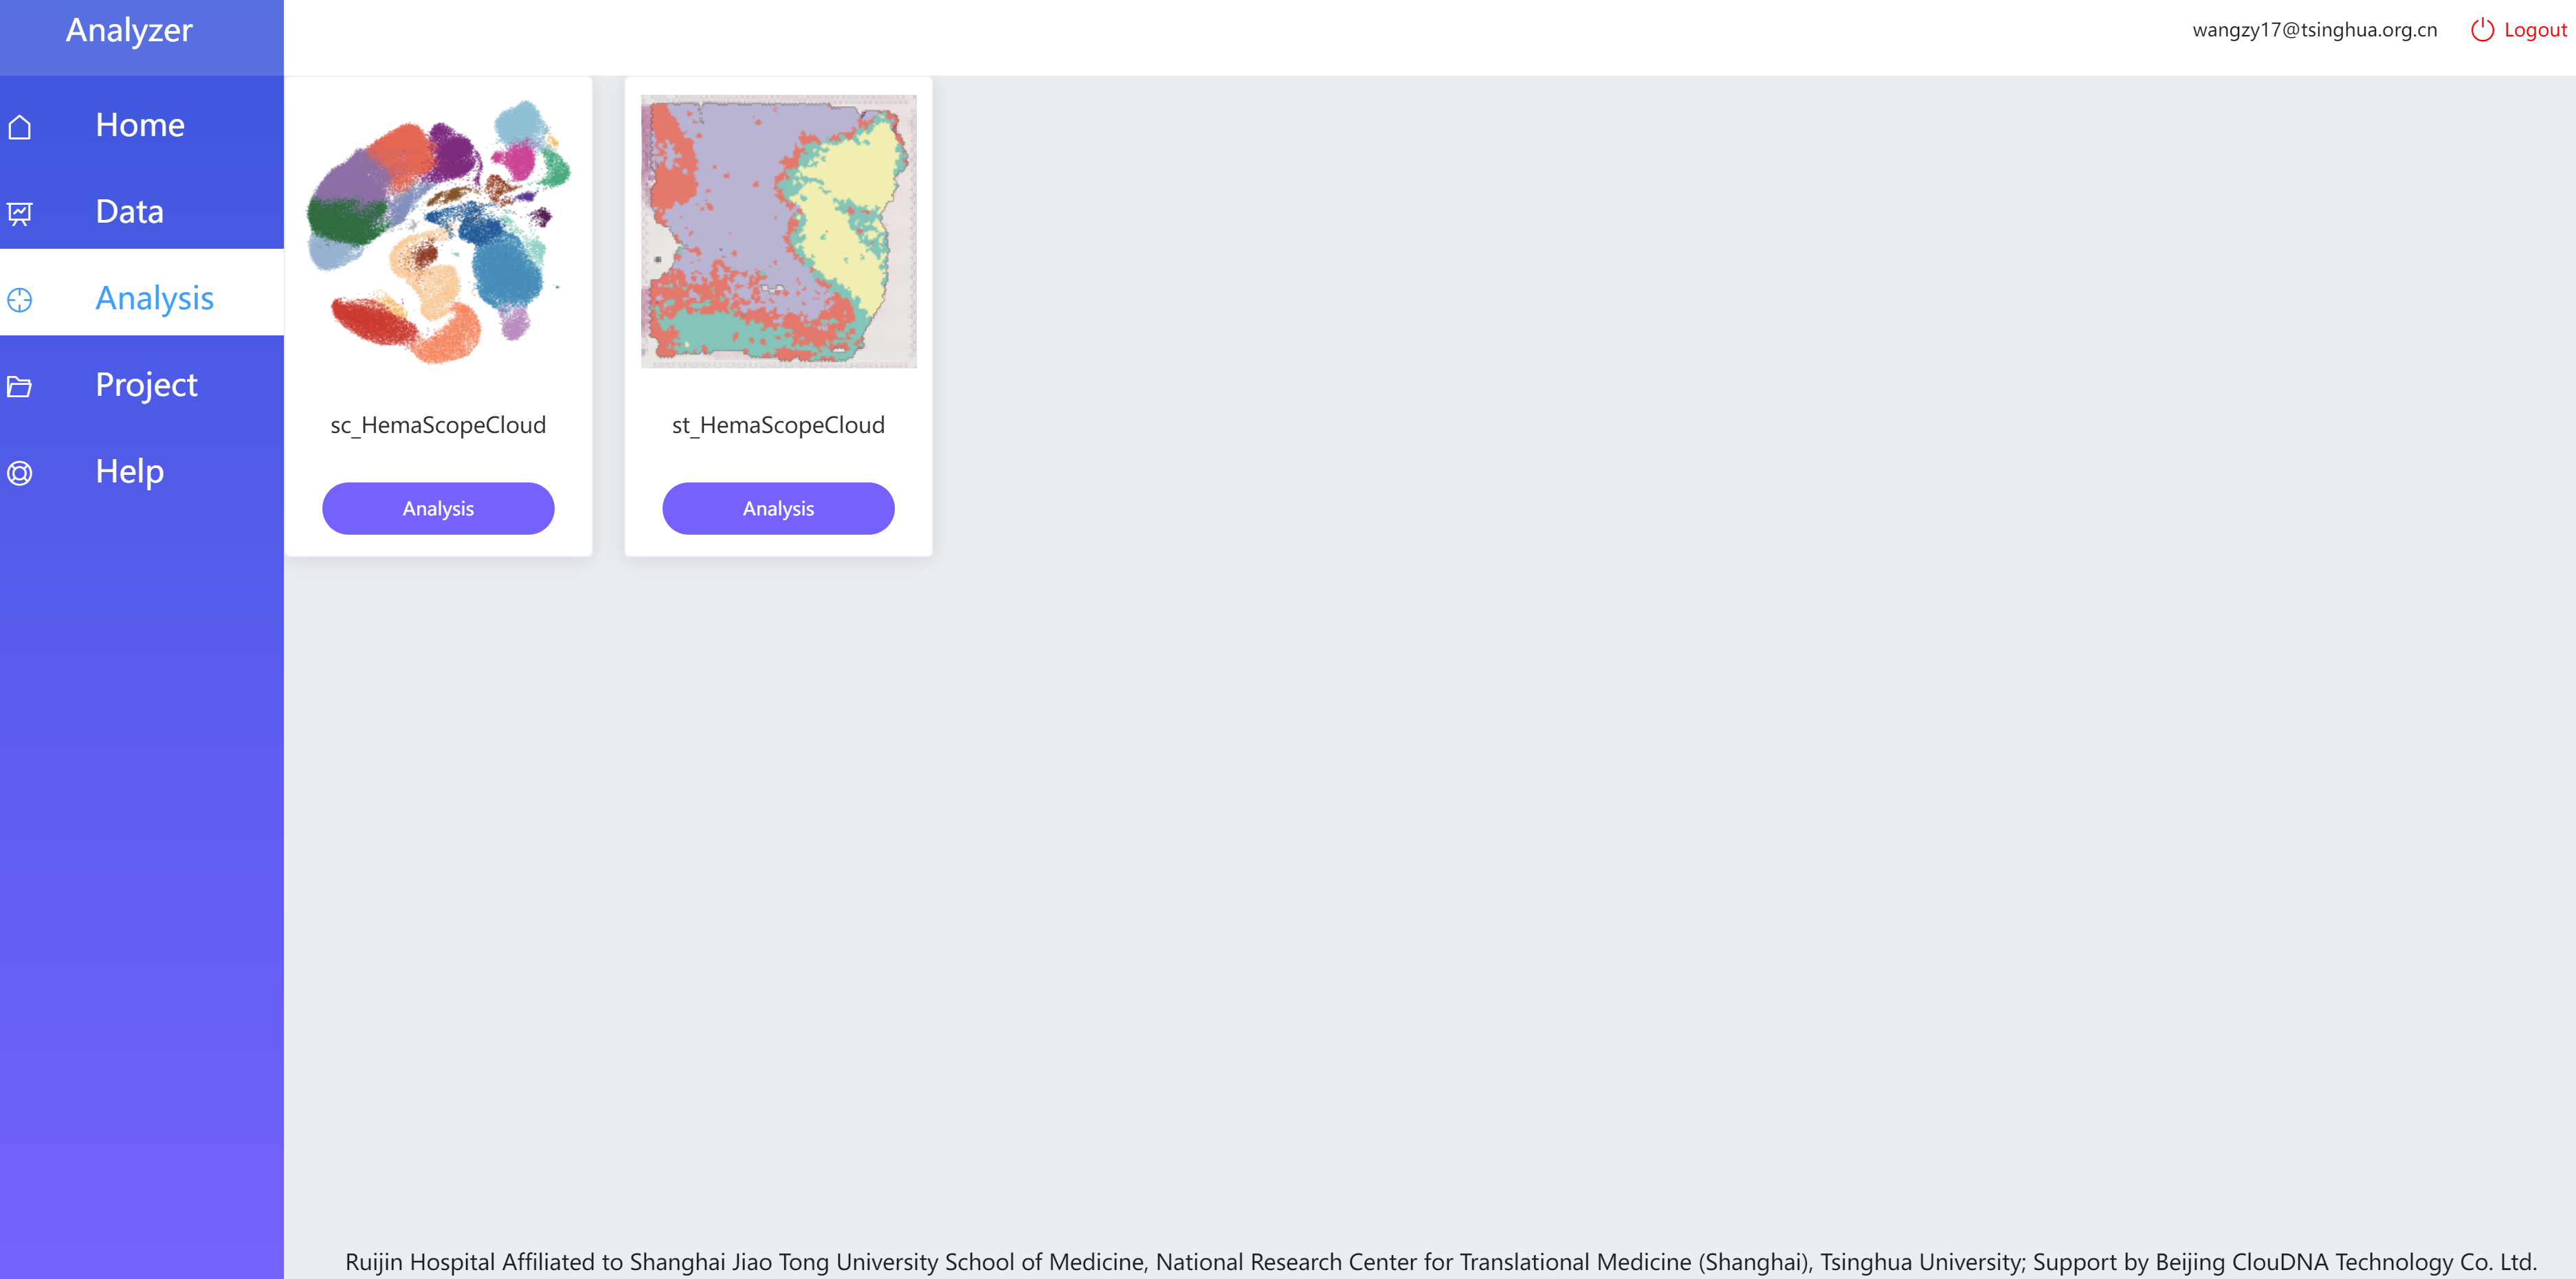
Figure 8.3: Select Analysis Pipeline Page
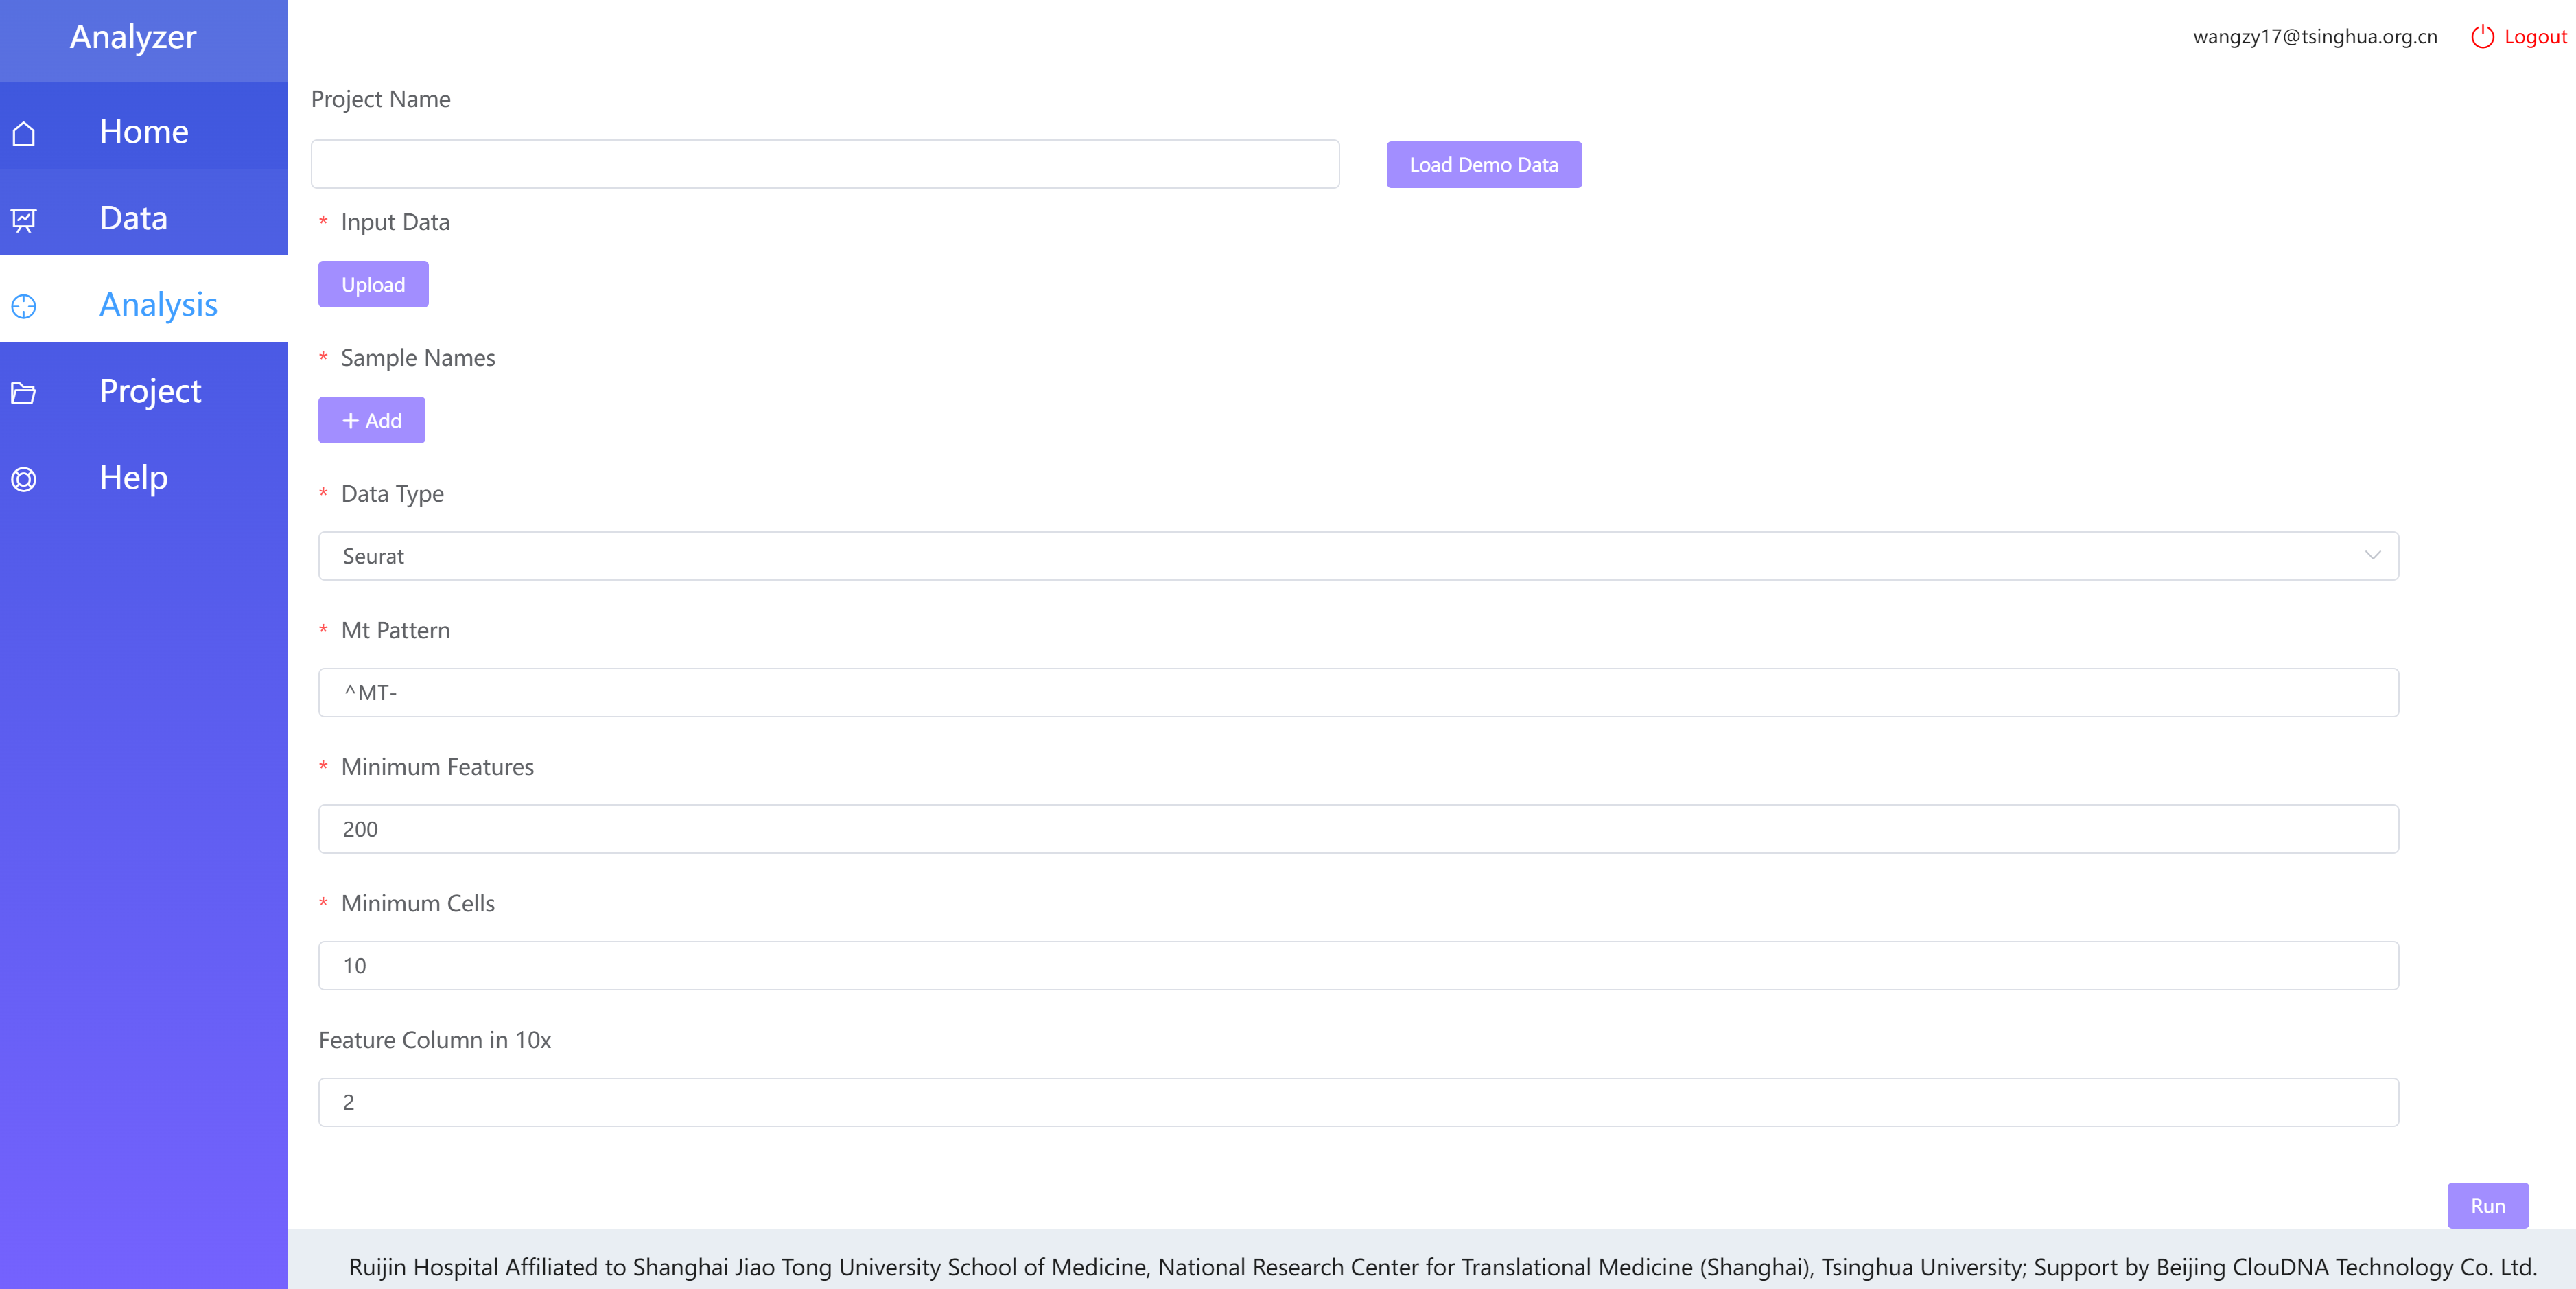
Figure 8.4: Enter the Analysis Pipeline Page
Create New Analysis Project
Click the Analysis button under the sc_HemaScopeCloud to enter the new project page for that pipeline.
Project Name:Enter the name of the analysis project for identification purposes.
Input Data:Click Upload to upload local analysis files. Single and multiple file uploads are supported. Uploaded files must comply with the pipeline’s input file requirements; otherwise, an error will occur during execution.
Sample Name:Click Add to enter the sample names, which should correspond to the uploaded analysis files.
Items marked with * are required fields.
Click the Run button to initiate the analysis:For the scRNA-seq pipeline,this will trigger step1-4; for the st-seq pipeline, it will trigger step1-5.
Each subsequent analysis step requires clicking Run on the relevant step page to submit. Before submission, ensure that the previous step has generated result files; otherwise, a notification will indicate that the analysis cannot proceed.
Load Demo Data
HemaScopeCloud supports loading pre-configured analysis demo files and default parameters to quickly initiate analysis projects. On the new project page, click Load Demo Data to load files from the demo project and fill the required fields. Then, click the Run button to execute the analysis for the demo project.
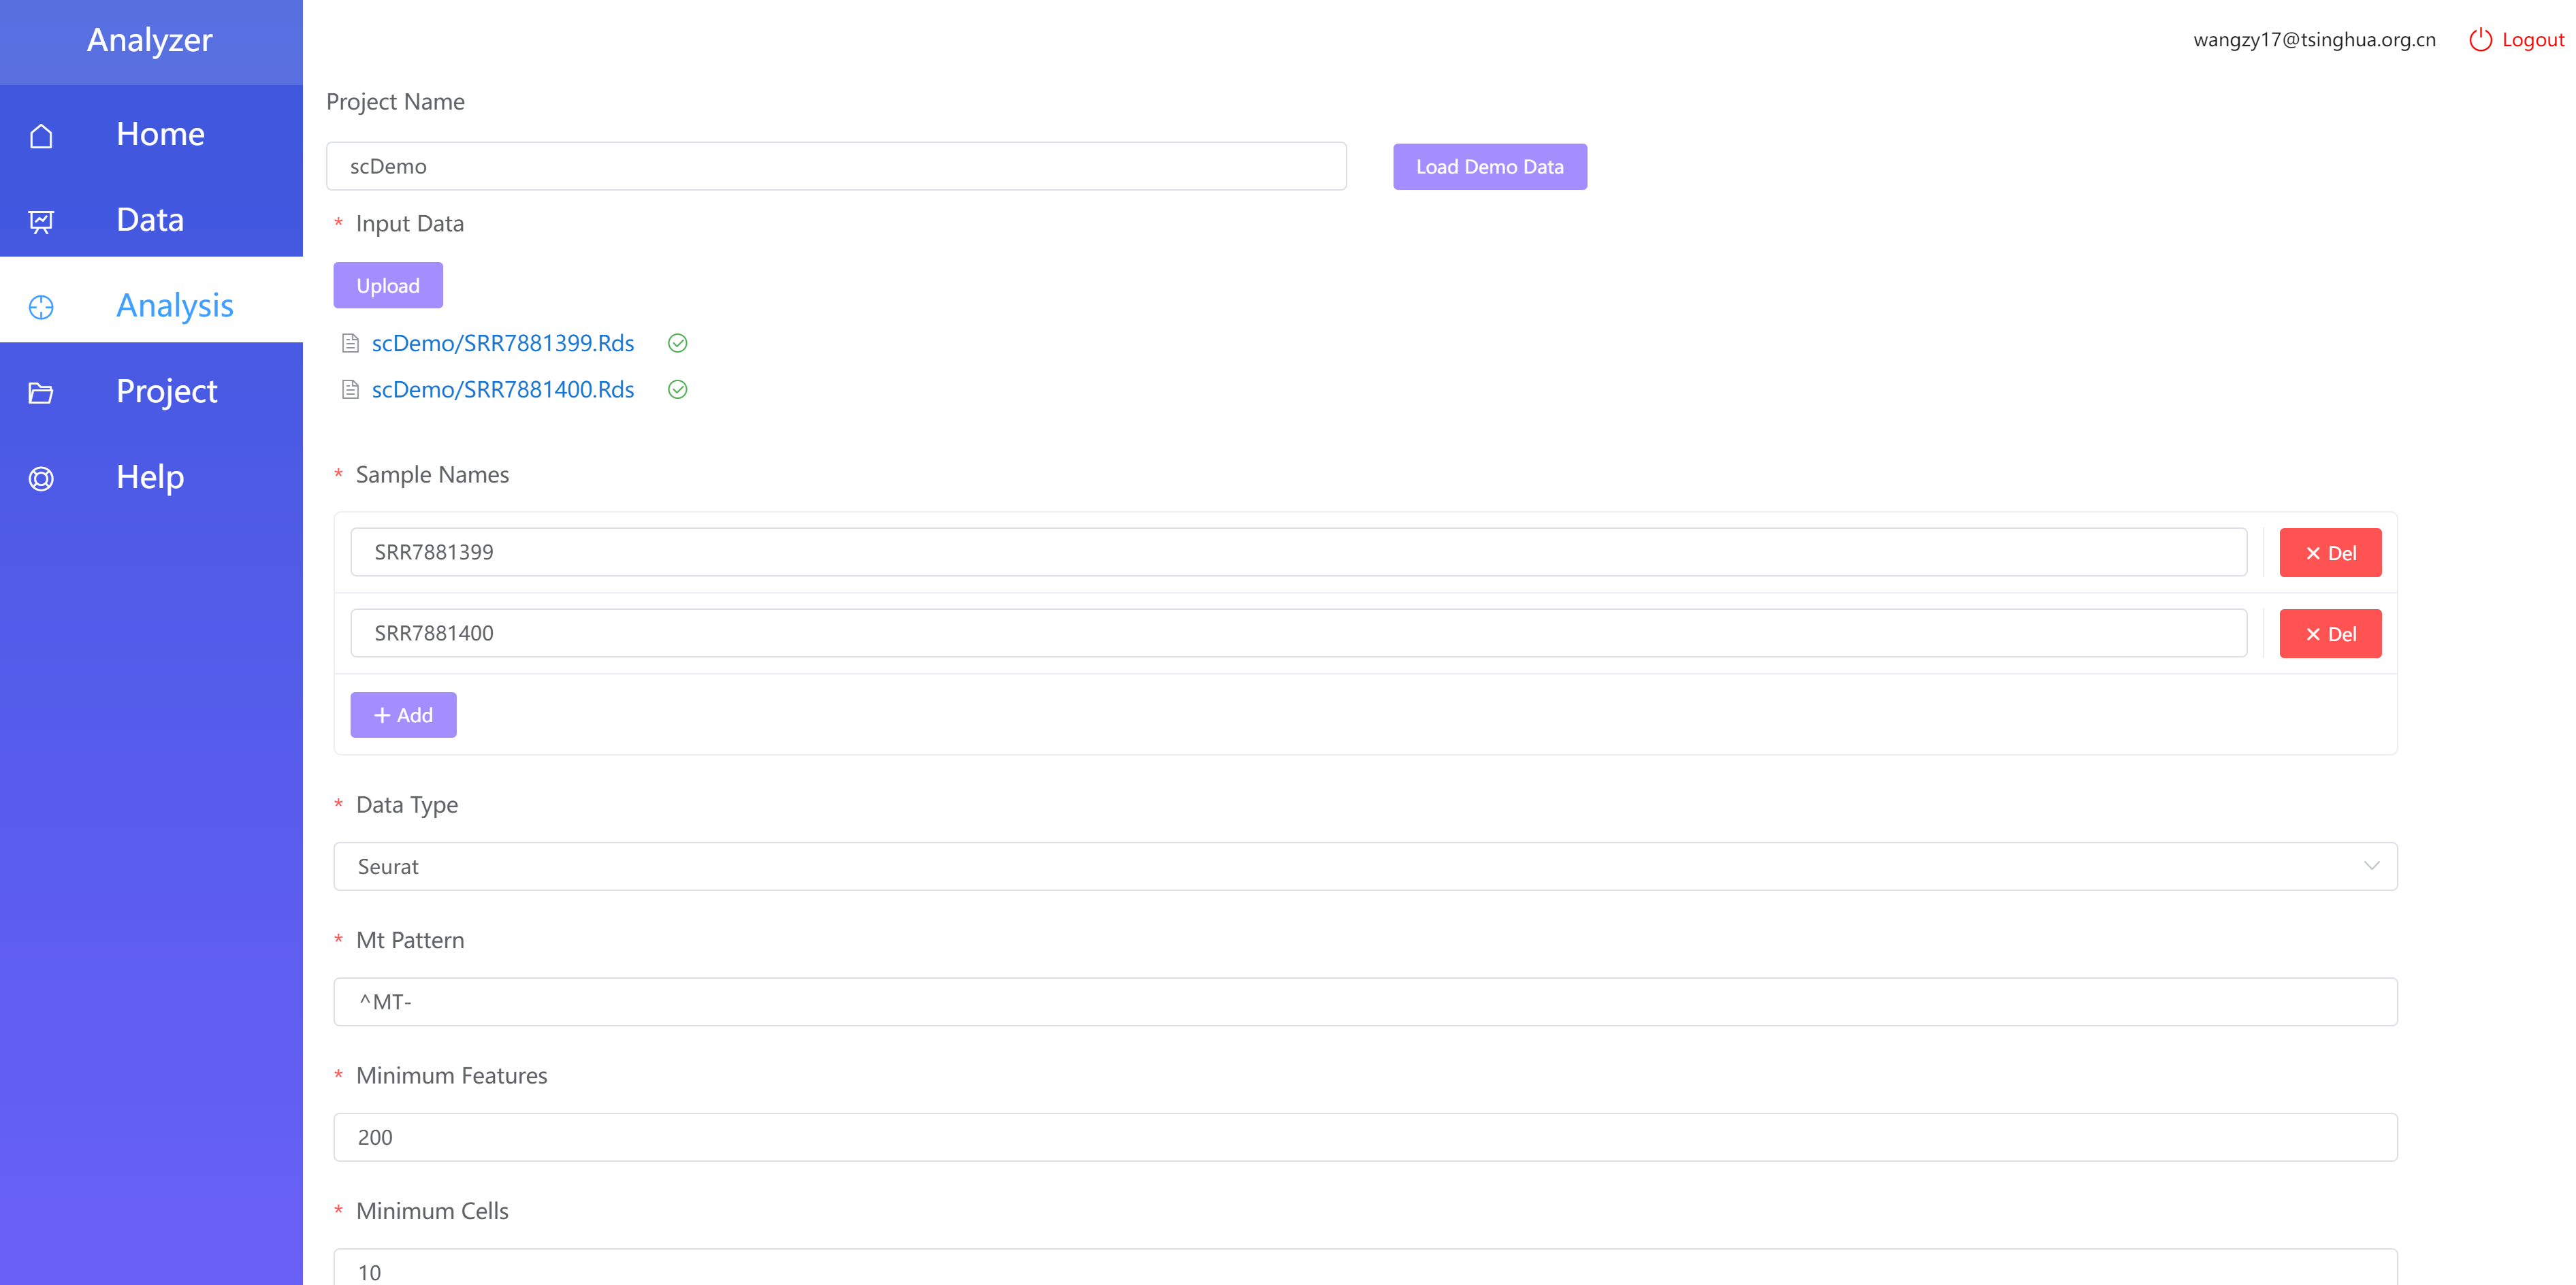
Figure 8.5: Load Demo Data
After clicking Run, you will be redirected to the detailed page of the analysis project.
Analysis Project Detail Page Notifications
Waiting for resources…Do not submit repeatedly: This indicates that the submission is waiting for resources. Do not click the Run button again.
Analyzing…Do not submit repeatedly: This indicates that the project is currently analyzing. Do not click the Run button again.
Analysis Steps, Current Analysis Step: Displays all stepwise analysis processes and the current step. Click on different steps to navigate to the corresponding analysis step page. For the initial analysis, you must complete the previous step before proceeding to the next one.
Refresh Button: Used to refresh the current page.
Results: This tab stores the results of the completed step.
Visualization: For steps that involve visualizations, the results will be found under the visualization tab.
History:Click on Run History to view all historical runs of that step.
Status:Corresponds to the analysis status of the project.
Log:Click this button to view the run log.
Parameter Settings:Used for entering parameter values.
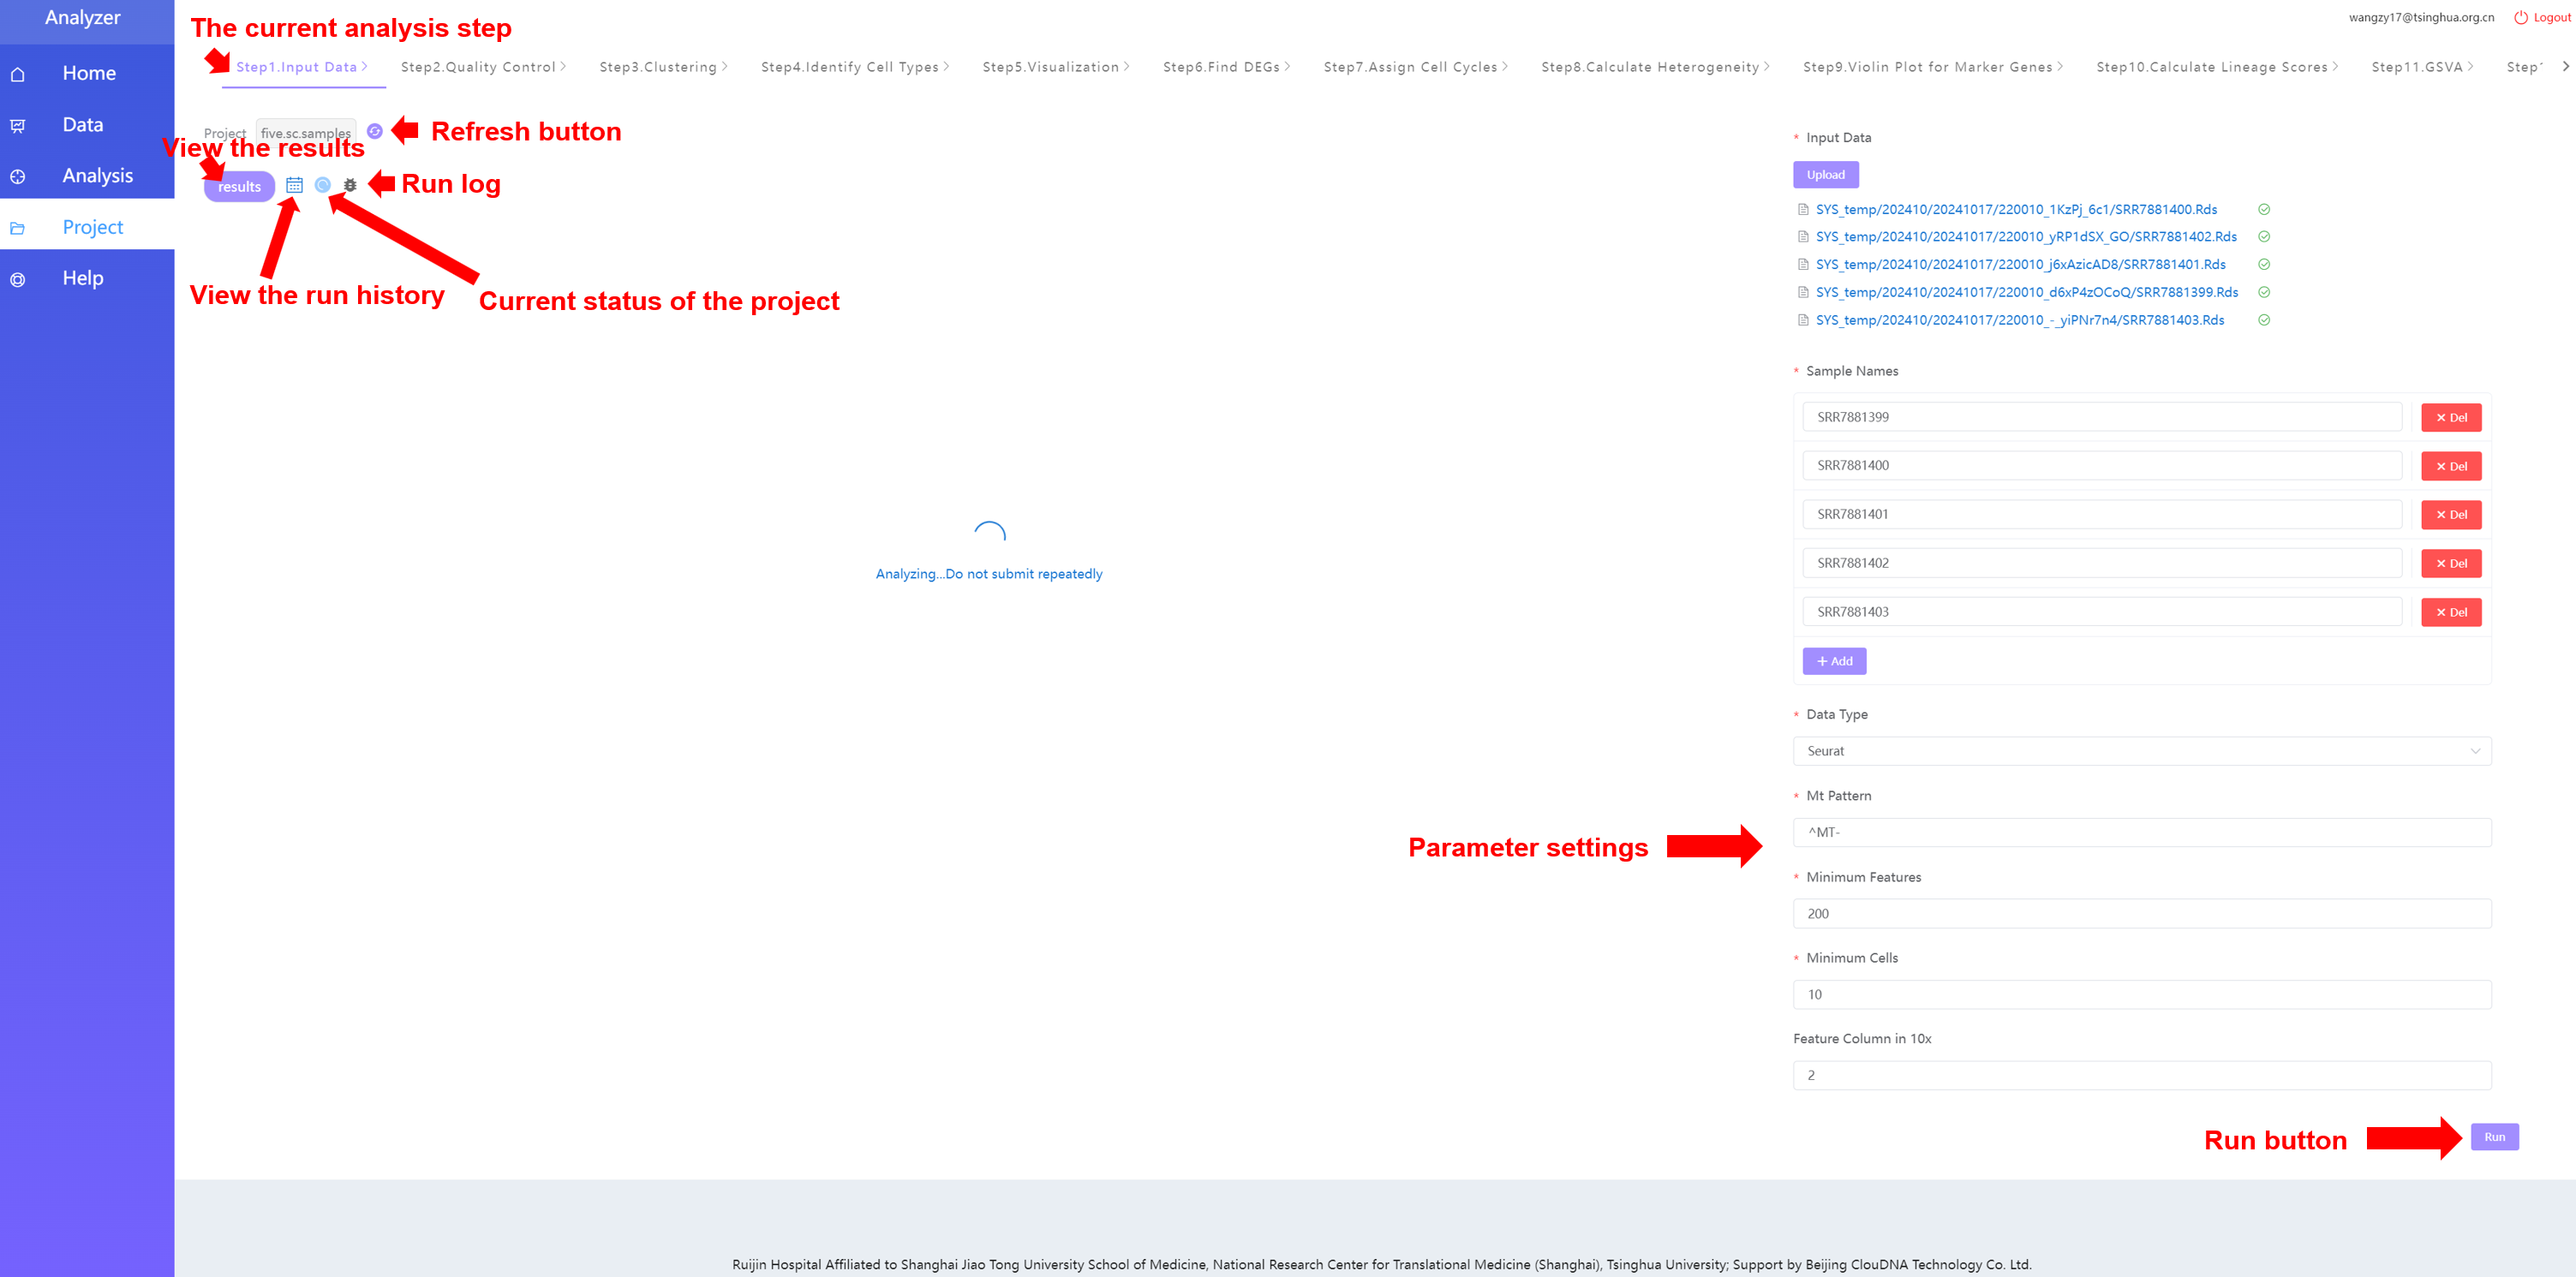
Figure 8.6: Analysis Project Page
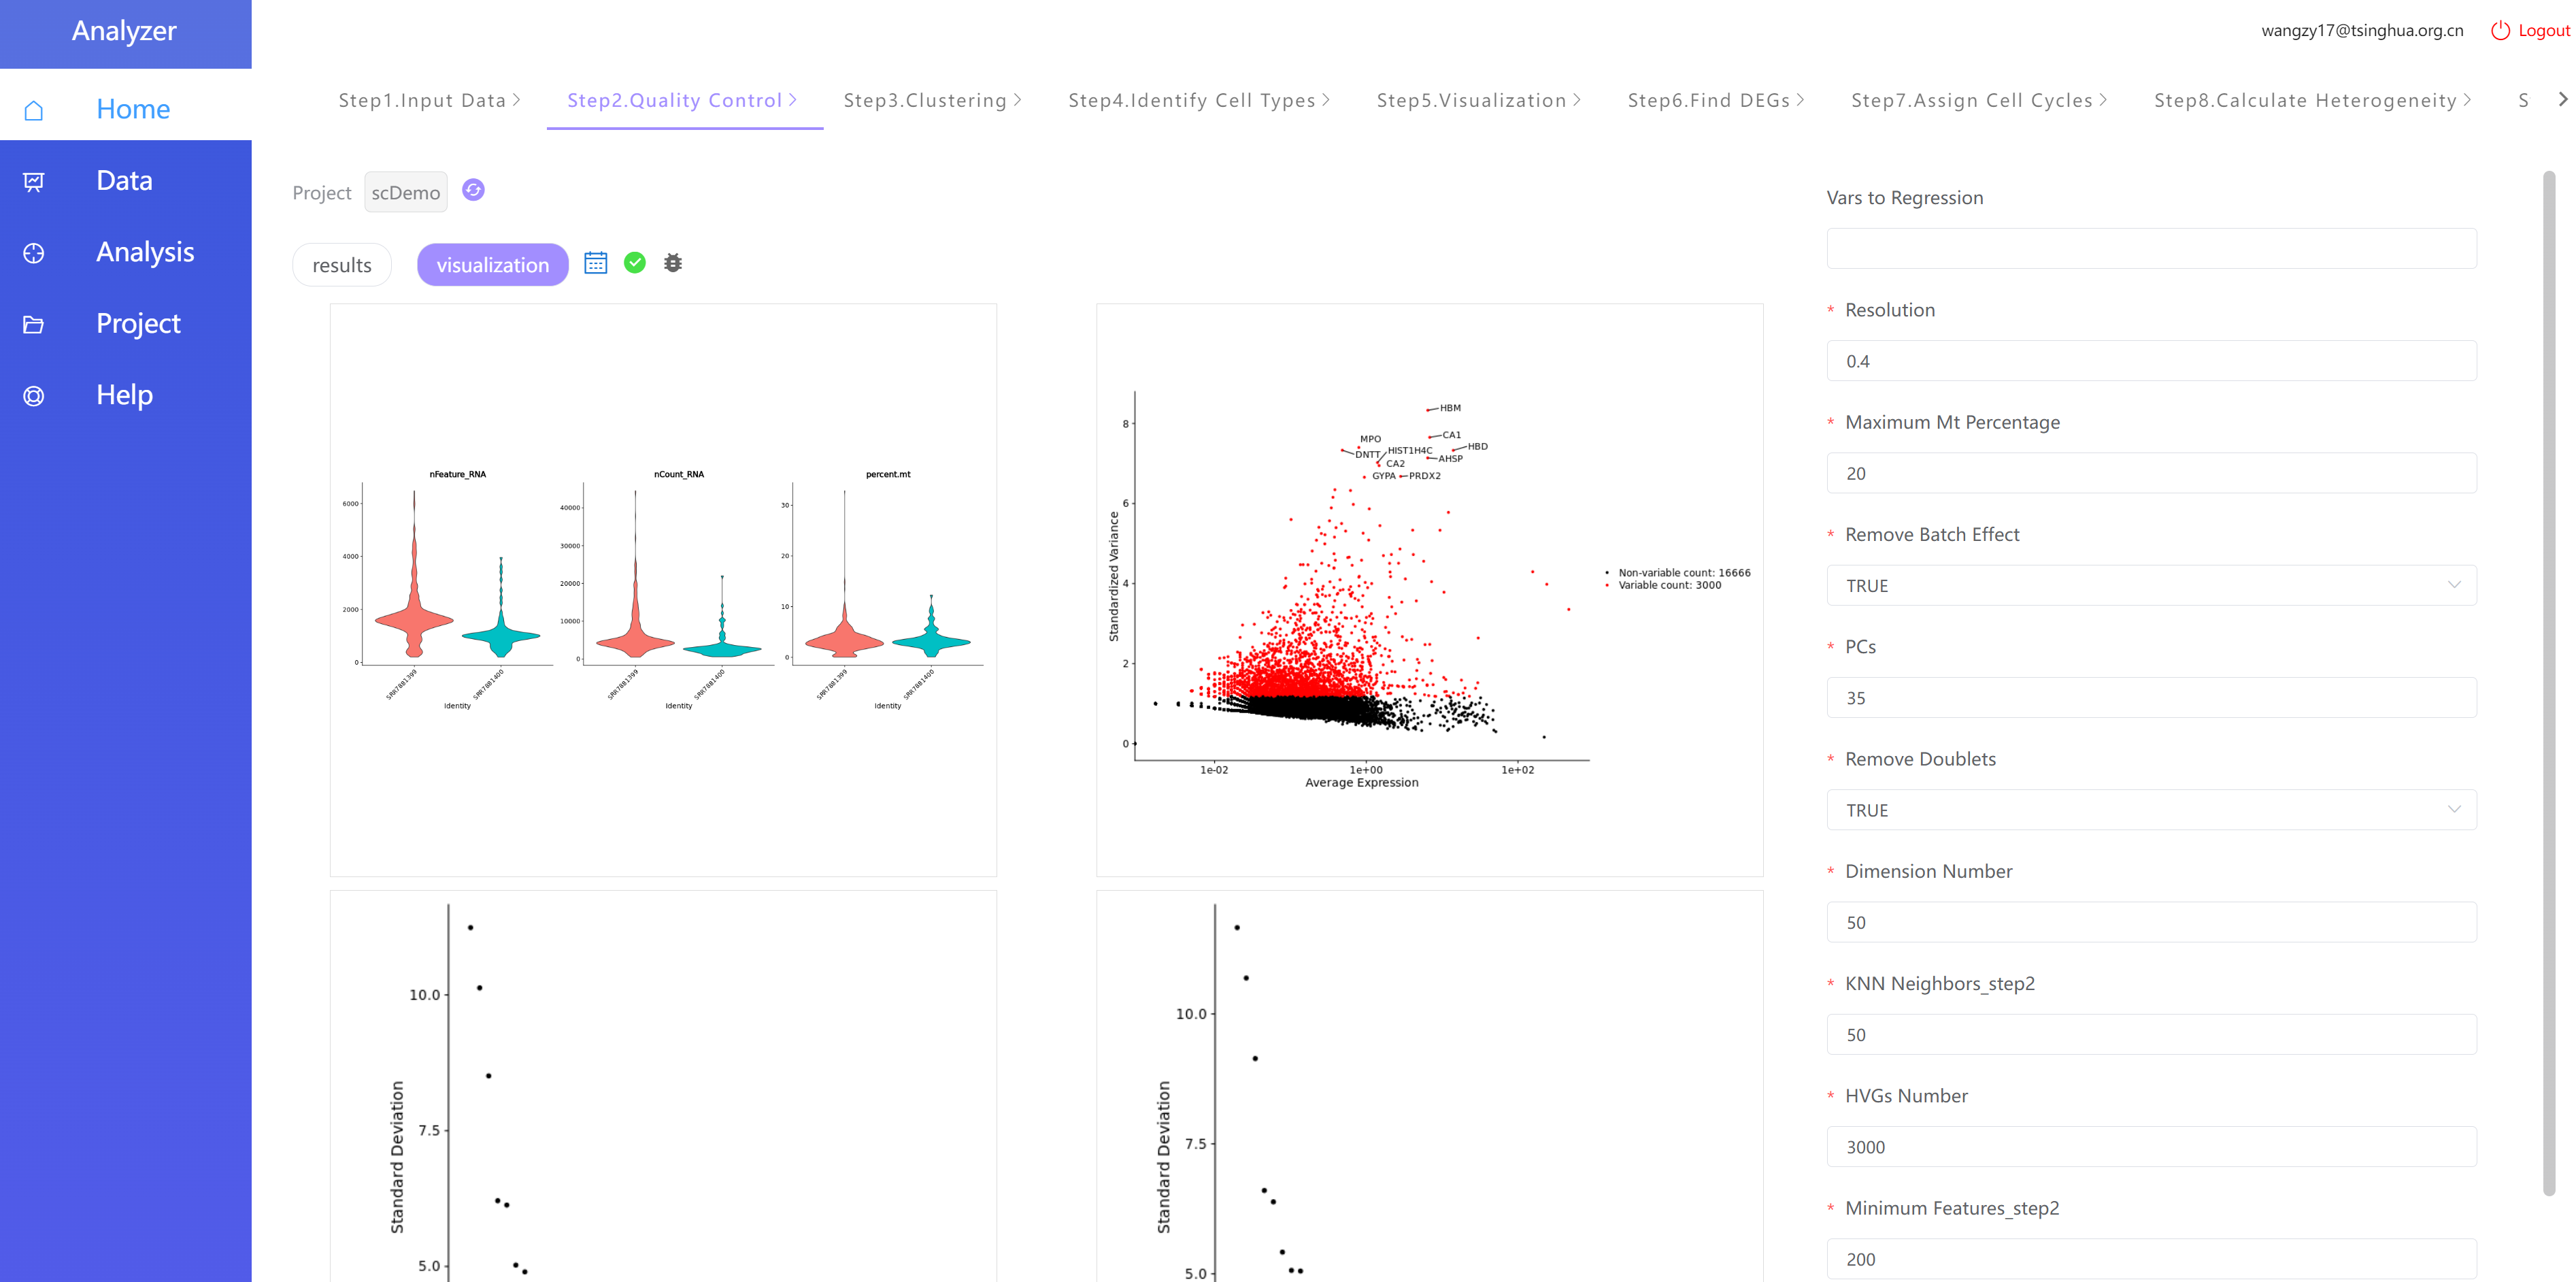
Figure 8.7: Analysis Project Result Page
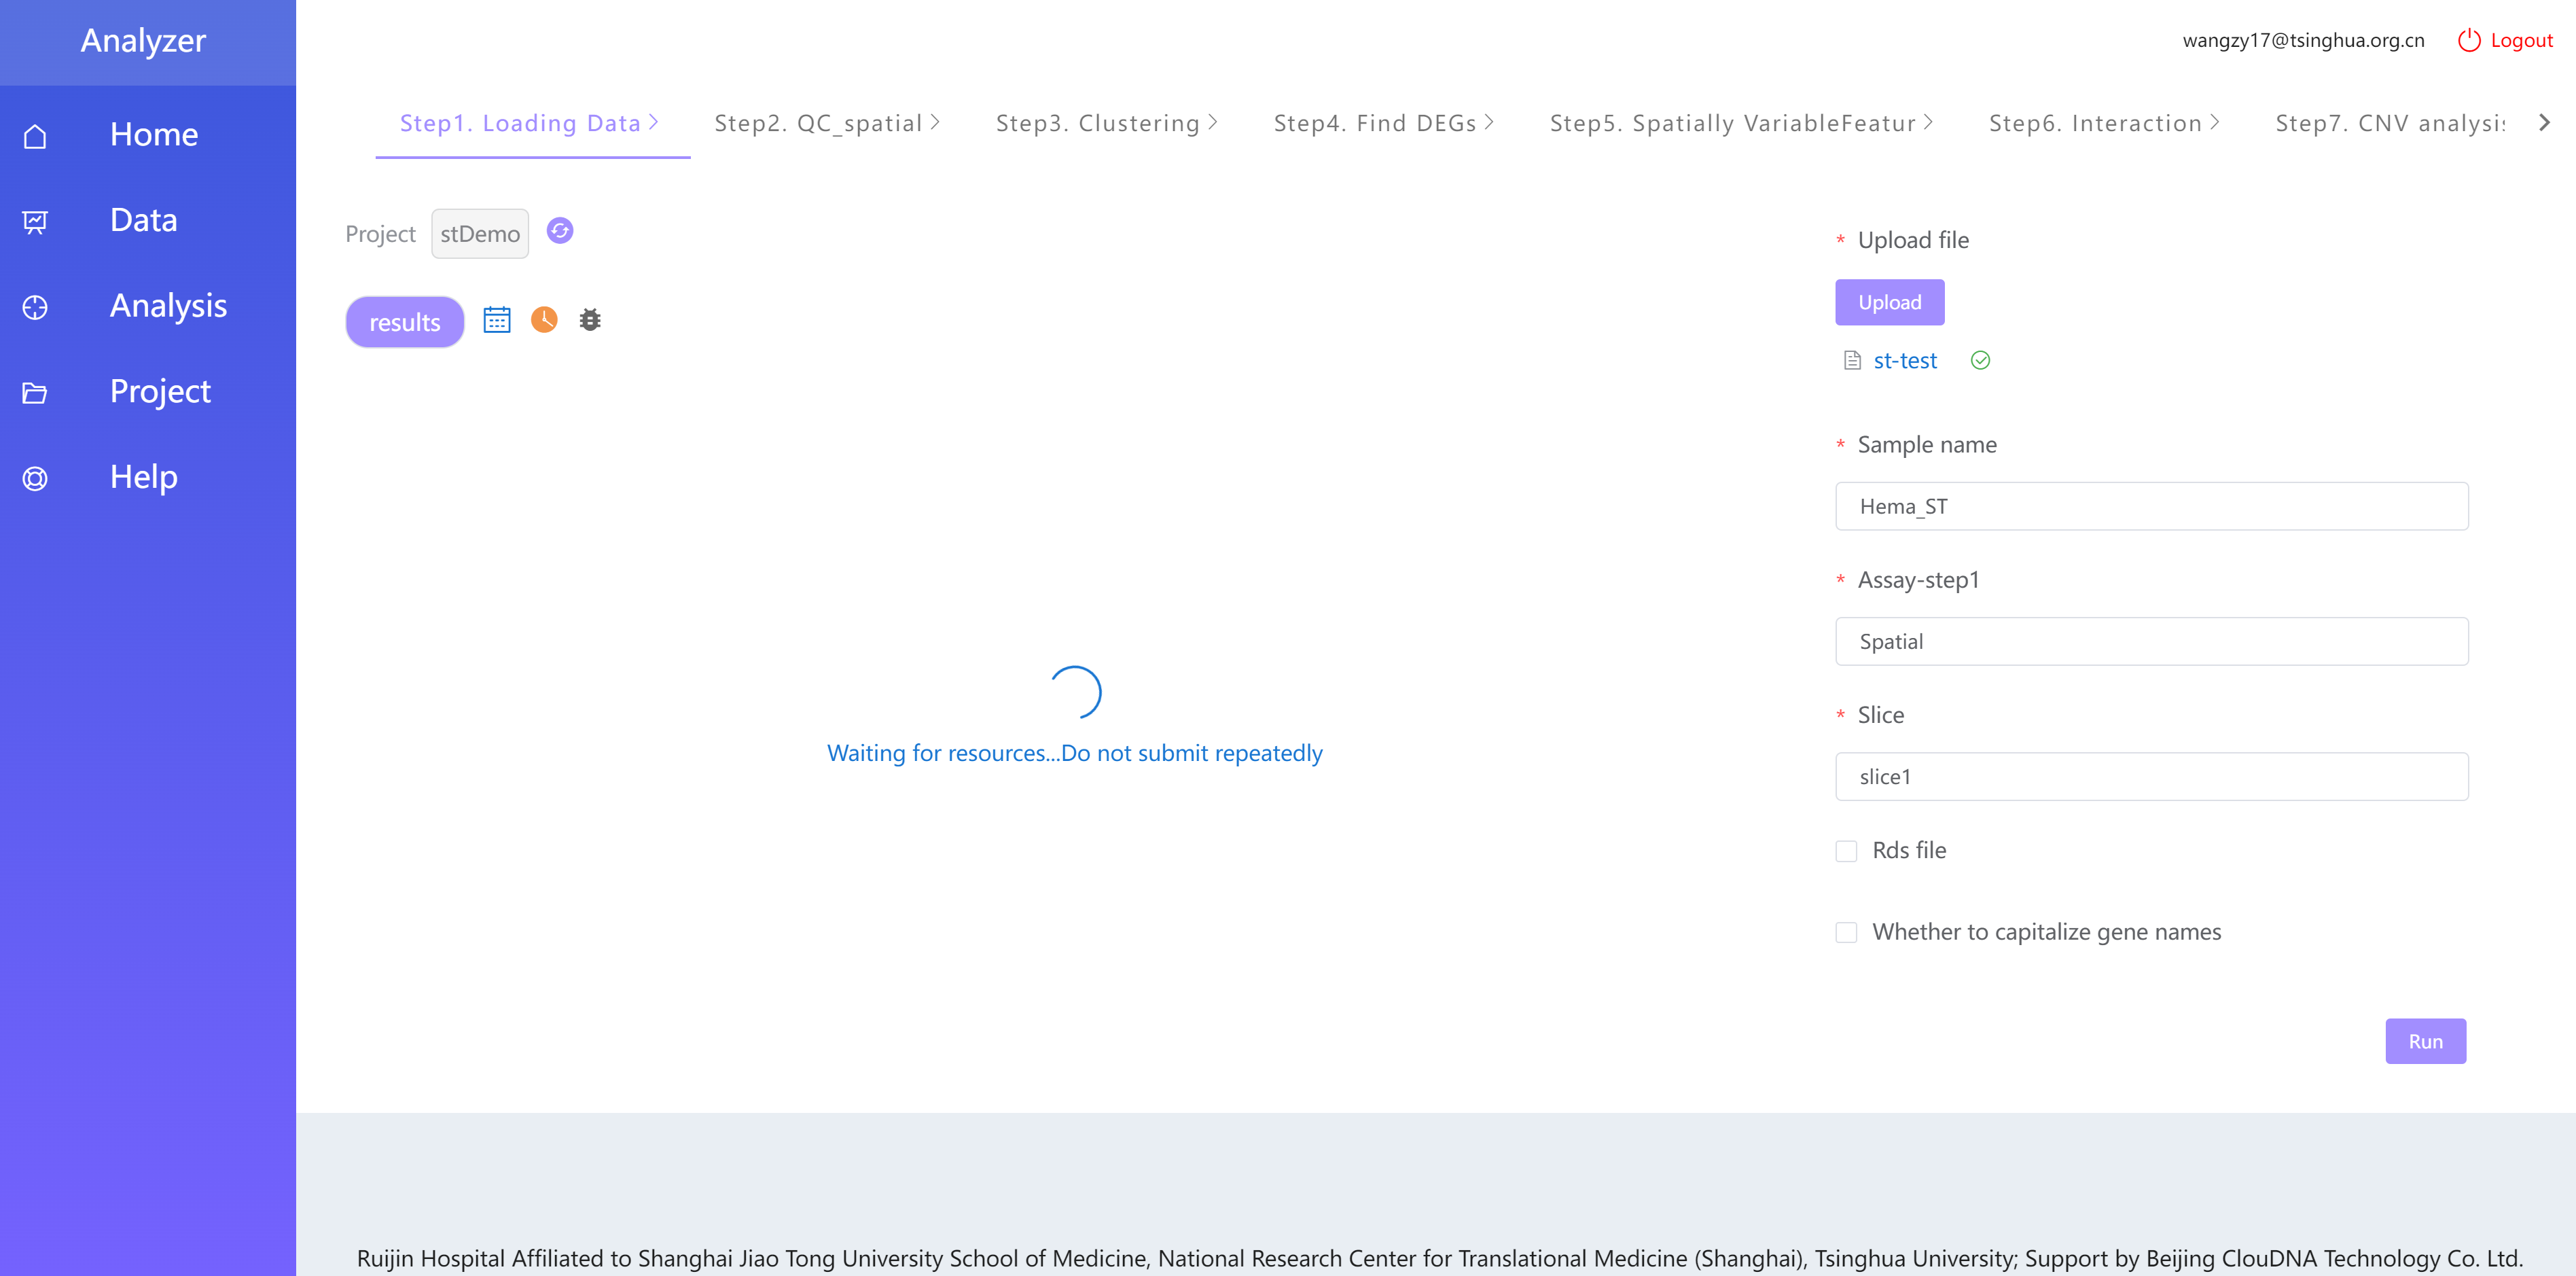
Figure 8.8: This step of the analysis project displays ‘Waiting for resources…Do not submit repeatedlly’
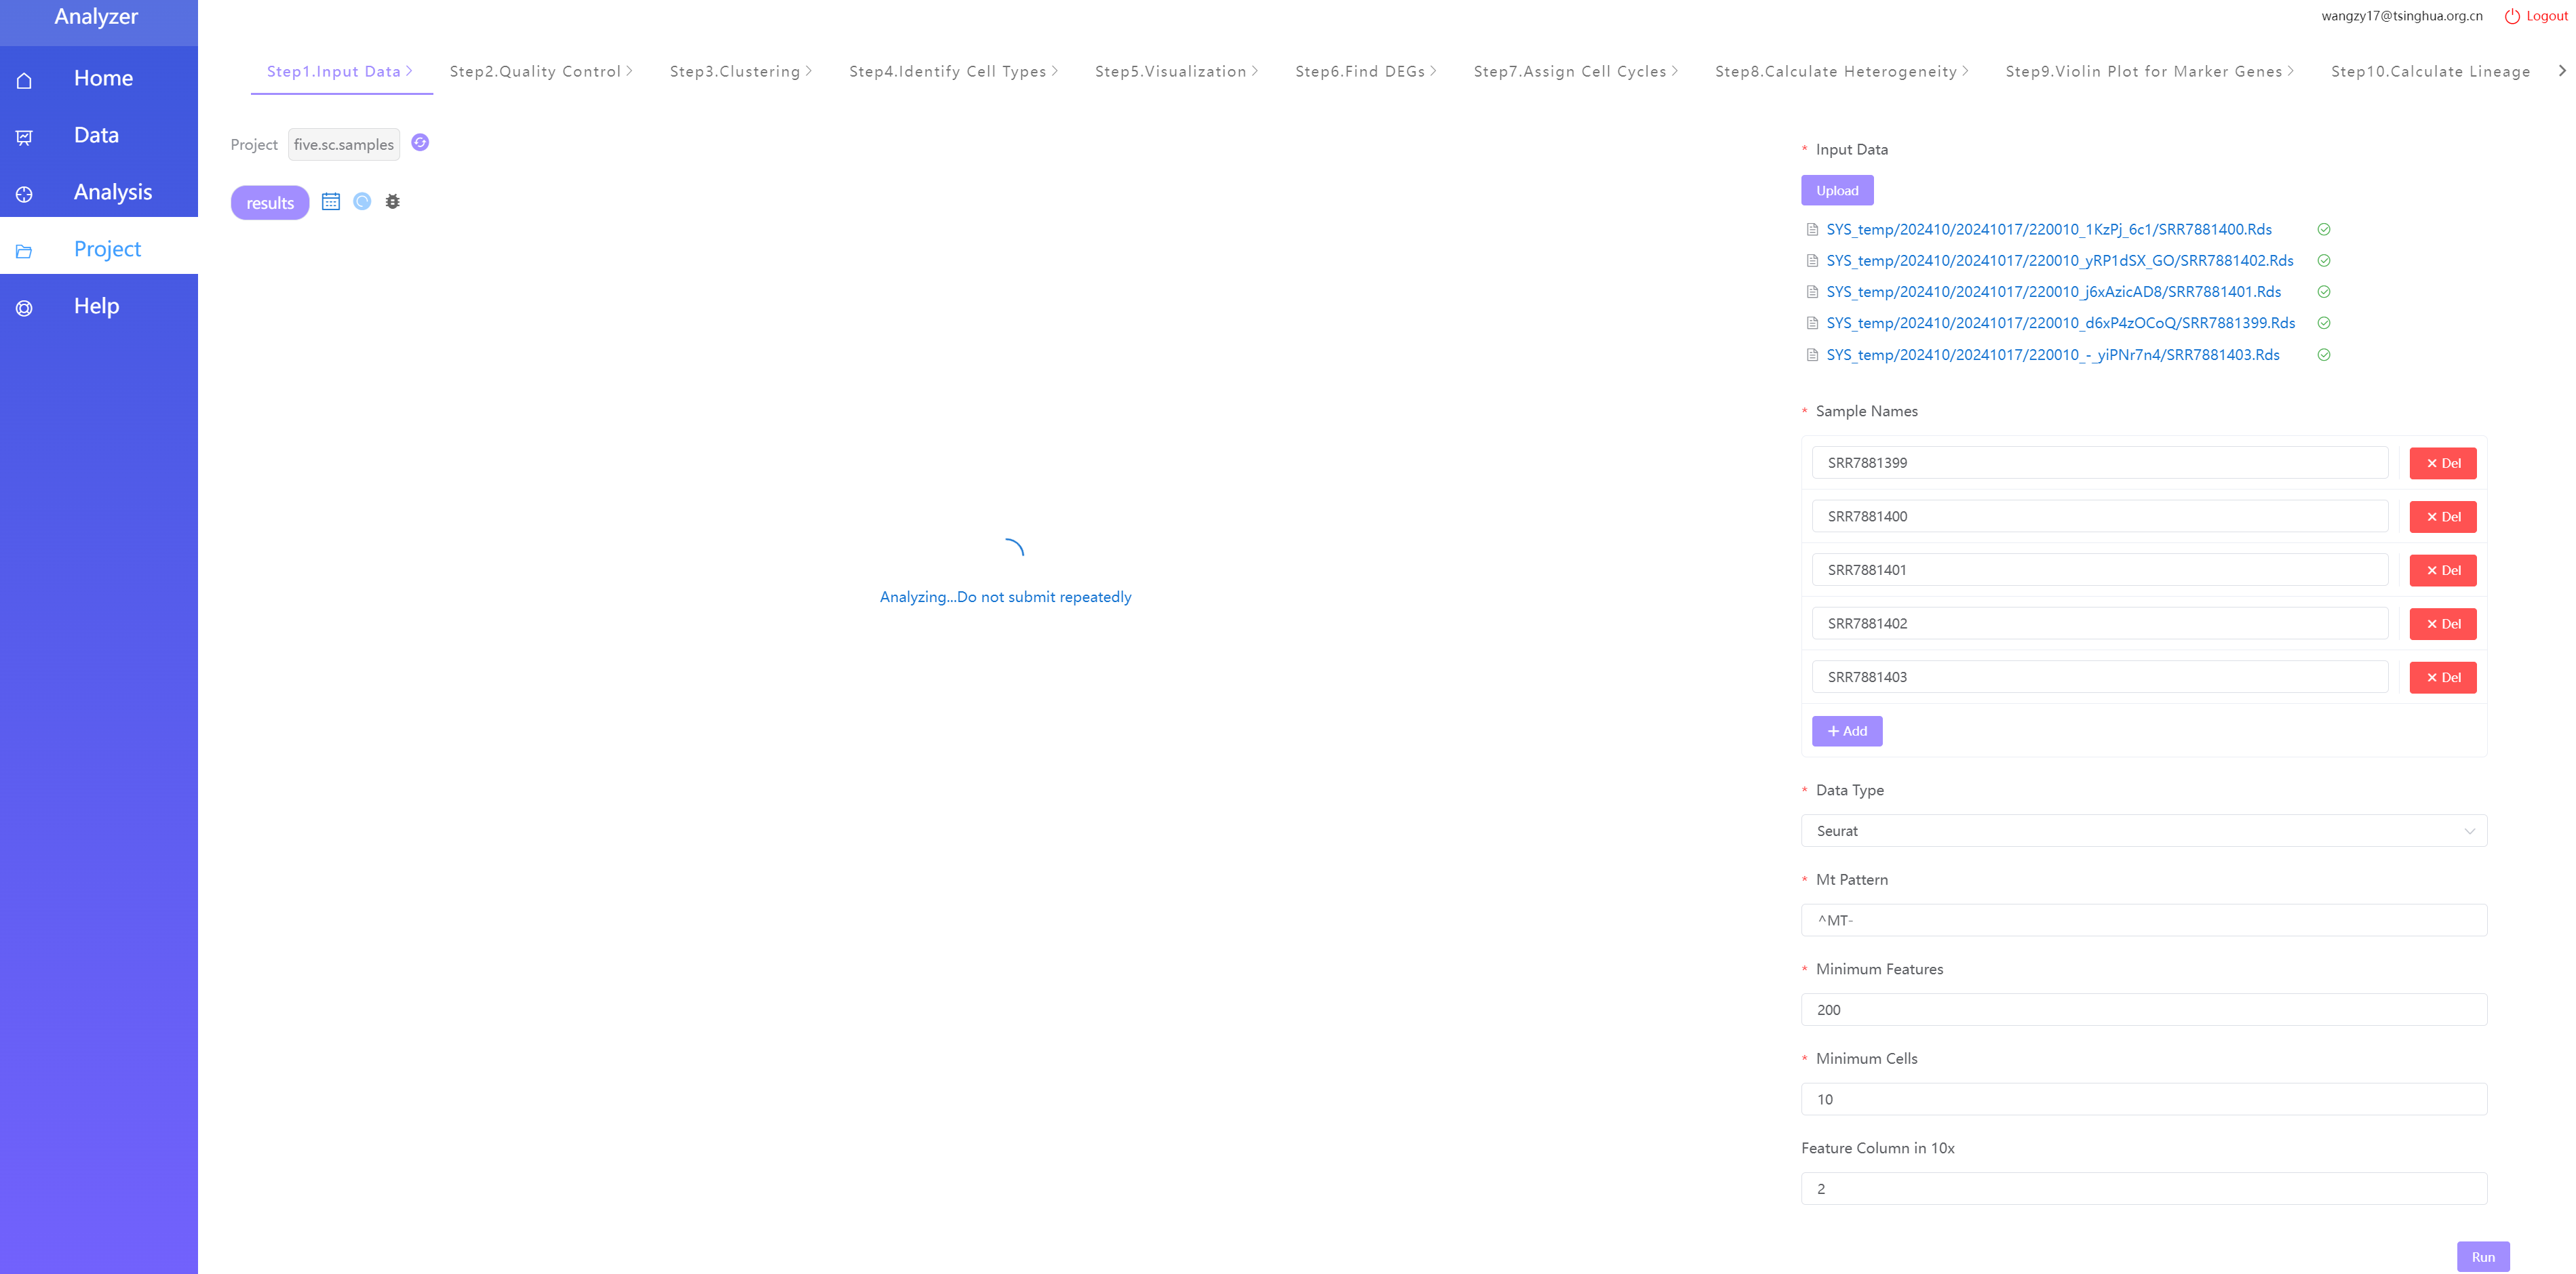
Figure 8.9: This step of the analysis project displays ‘Analyzing…Do not submit repeatedly’
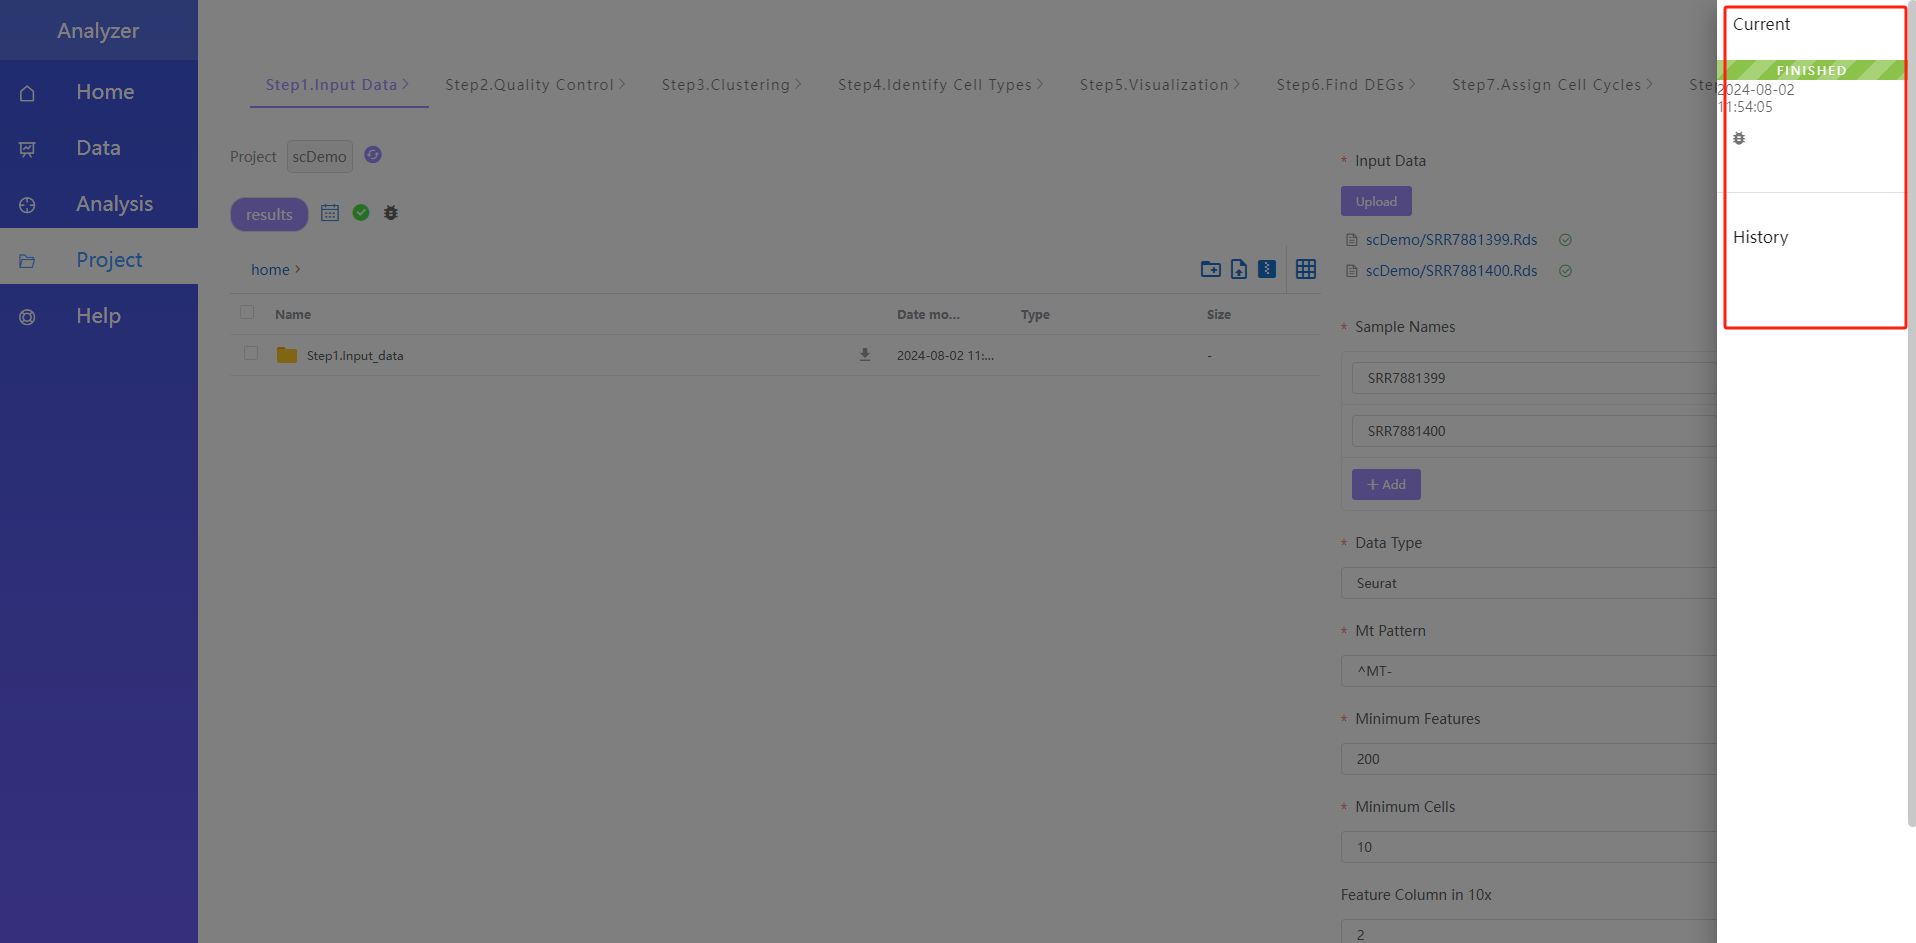
Figure 8.10: History Page
Note: For steps that have already been completed (except for the first step), you can adjust the parameters and click Run to perform multiple analyses. The results page will retain only the latest analysis results.
8.5 Projects page
The homege includes analysis projects created by the user as well as pre-configured demo analysis projects provided by the system.
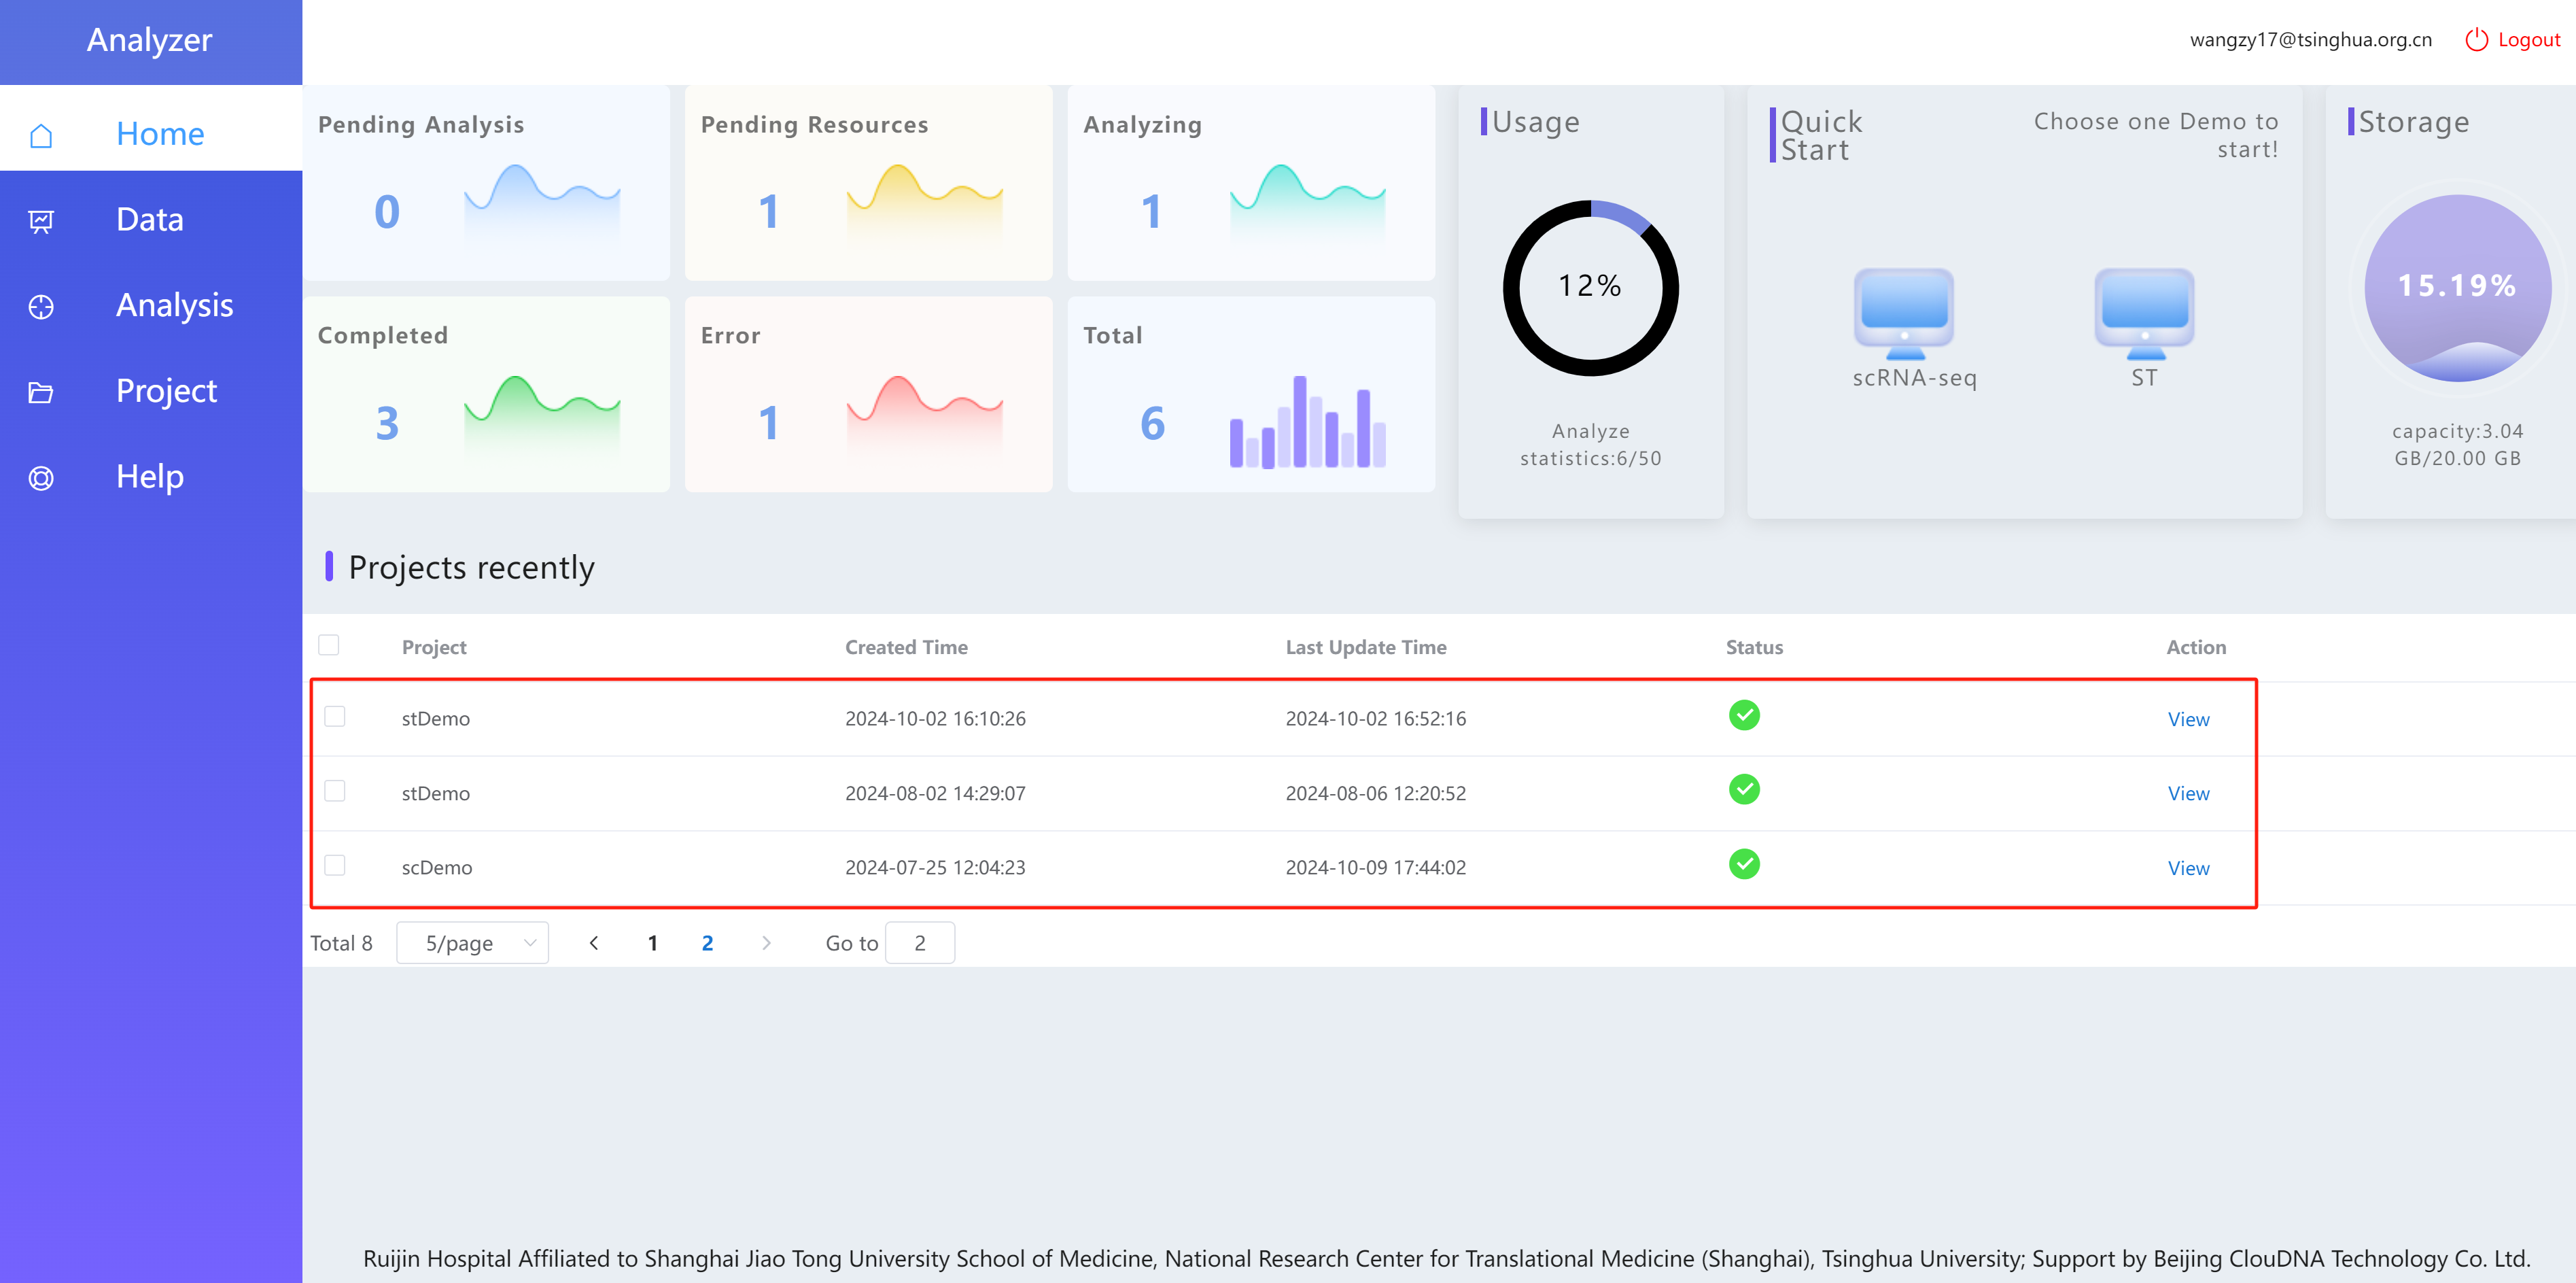
Figure 8.11: Demo projects and user’s personal projects
Clicking “View” allows you to navigate to the analysis project for review and step-by-step analysis.

Figure 8.12: Click ‘View’ to access the analysis project
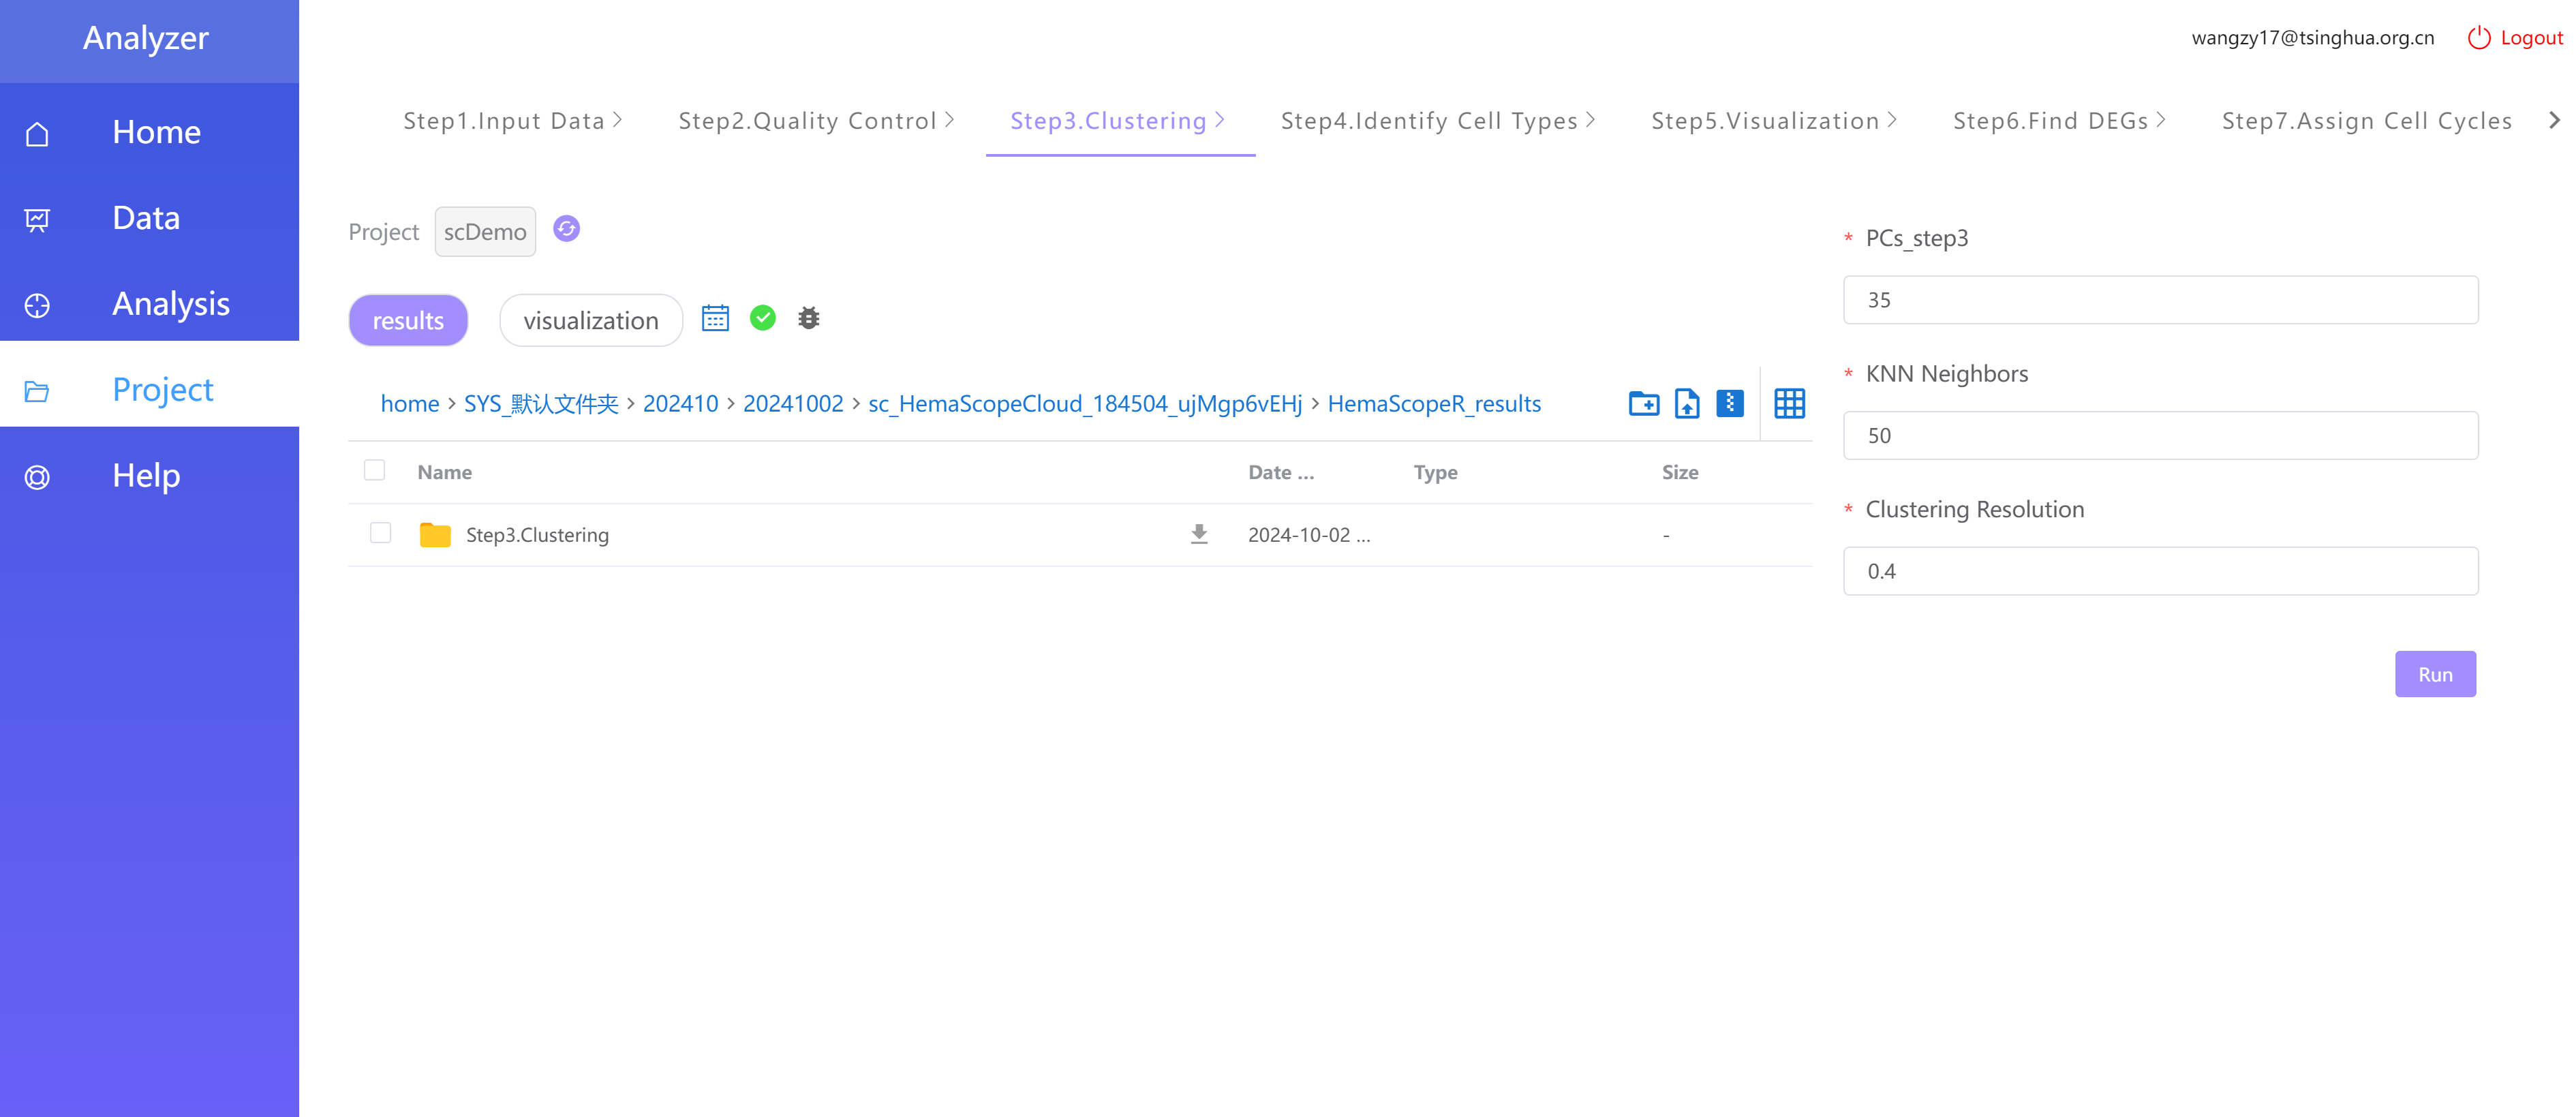
Figure 8.13: Enter the detailed analysis project page